
Ghana
When: 2016–2019
Purpose: Explore strategies for sustainable development in the water-energy-food nexus, particularly on agricultural production, water competition, bioenergy, and energy security & affordability.
What happened: A CLEWs model was built with a 2016–2050 simulation horizon. It represented agricultural, commercial, industrial, residential, and transport demand and produced projections on power-generation, imports, and cost results.
Key insights:
- In 2016, Ghana produced 9,598.4 ktoe of total energy supply with only 7,085.2 ktoe of final energy consumption (residential demand 44%, transport 37%, industry 12%, commercial 5%, and agriculture & fisheries 2%)
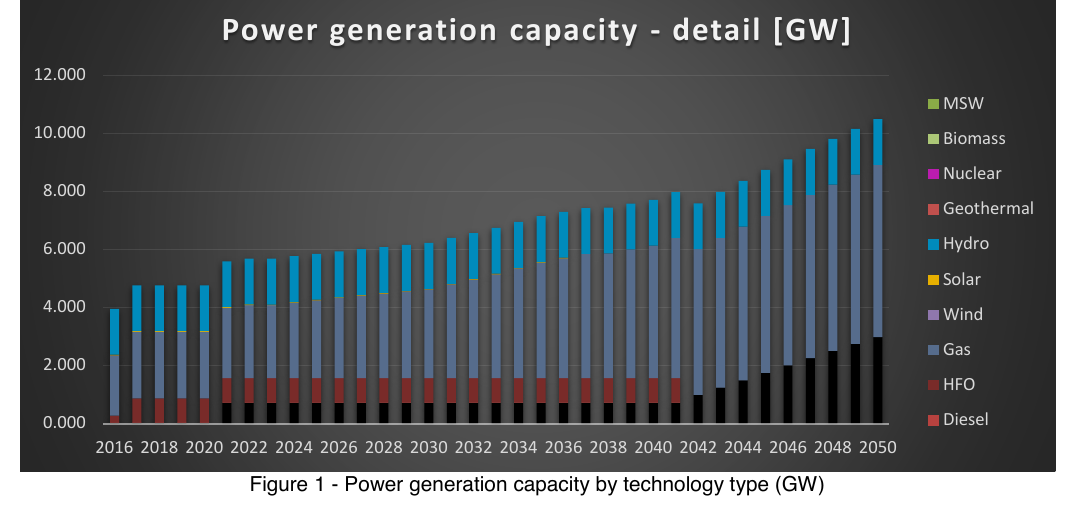
- Total generation capacity will grow 118% by 2050, from 4.8 GW to 10.5 GW, with hydro fixed at 1.6 GW and gas & coal taking larger roles as the least-cost solution
- Petroleum products dominate energy imports (75%) with LNG accounting for most of the remainder
- Electricity generation costs begin at USD 56/MWh in 2018, rise to USD 60/MWh in 2020, and finally fall and stabilize near USD 50/MWh by 2050 as the fuel-cost share falls from 75% to 50%.
Resources: Ghana OSeMOSYS modelling report and supporting energy-statistics material.
Models: OSeMOSYS
Stakeholders: Government of Ghana, Northern Development Authority, National Development Planning Commission, Energy Commission, UN DESA, UNDP, IAEA